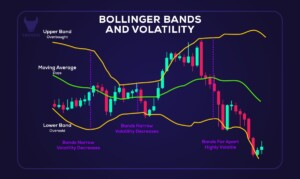
One of the classic trend indicators is the Bollinger bands (BB) indicator, developed by John Bollinger. His book Bollinger on Bollinger Bands contains a detailed description of how to use it on its own as well as with other tools of technical analysis. BB is very popular among traders all over the world. It is a type of statistical chart characterizing the prices and volatility over time of a financial instrument or commodity, using a formulaic method.
How to use Bollinger bands to trade Forex
- The assumption is that the price spends 95% of the time between the outer Bollinger bands and only 5% of the time outside of them.
- Bollinger bands help to determine how big is the deviation from the average price of a currency pair.
- The middle line may be used as a level of support/resistance, while the outer borders can act as profit targets. There are also strategies that suggest reversing trade from outside bands.
- The slope of BB and the position of the price relative to the middle band allow judging the direction of the current trend. It’s an uptrend, if Bollinger bands have an upward bias and the price tends to be above the middle line.
- It’s a downtrend, if the band’s bias is negative and the price spends the majority of time below the middle line.
