
#Parabolic SAR is a powerful tool that helps you analyze trends. SAR stands for Stop and Back. This means that the indicator can not only determine the trend, but also signal when it is time to close the trend trade and look in the opposite direction. The indicator was developed by J. Welles Wilder, who is also known for creating tools such as ATR and RSI.
How to interpret a parabolic SAR indicator
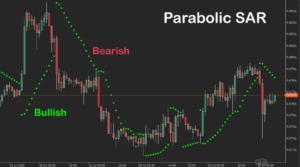
- Parabolic is very easy to use. Makes points that determine the trend. When the points are below the price, the trend is bullish, while the points are above the bearish trend.
- When the trend changes direction, the parabolic signal gives an input signal. It signals a bearish turn when it crosses the price upwards and forms 3 descending points above the candlesticks.
- The parabolic signals whip when it crosses the price to the back and forms 3 ascending points below the candles.